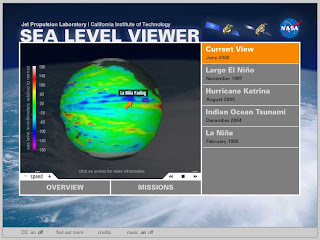
 Heat from the oceans is a driving force of climate, and the best place to watch ocean heat circulate is from space. Now Internet users can access these data by using the Sea Level Viewer, an interactive visualization tool developed at NASA's Jet Propulsion Laboratory (JPL), Pasadena, Calif.
"Sea level is an important type of climate data, already used by many scientists," said Randal Jackson, who produces NASA’s Global Climate Change website out of NASA JPL. "Our goal was to present it in a form that’s visual, interactive and accessible to the general public."
Since 1992 NASA and the French space agency CNES have operated satellites that measure the precise height of Earth's oceans. In 1992, TOPEX/Poseidon launched and it was followed by the Jason-1 satellite, launched in 2001. The Ocean Surface Topography Mission on the Jason-2 satellite launched in June 2008, as a follow-on mission to Jason-1. The sea level height reflects the amount of heat stored in the water which is extremely important in hurricane forecasting.
 The NASA Sea Level Viewer provides users with an up-to-date look at recent ocean topography data, allowing them to explore a global view or watch videos explaining the impact of sea surface height on Earth's climate. The Sea Level Viewer is accessible through NASA’s Global Climate Change website, http://climate.jpl.nasa.gov.
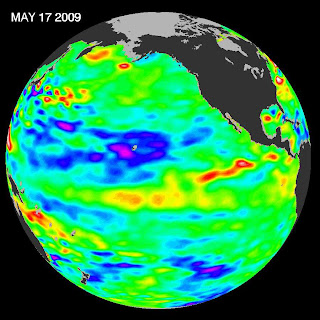
On the Sea Level Viewer webpage, click on the "current" button to see a recent map of sea level data as collected by the Jason-1 and Jason-2 satellites. The data are presented on a revolving globe, with clickable hot spots that explain recent trends. In the global view, white areas represent sea surface heights between 8 and 24 centimeters (3.1 to 9.4 inches) above normal, indicating warmer, expanded water. Dark areas represent sea surface heights between 8 and 24 centimeters below normal, indicating cooler water.
Users can also click to learn about noteworthy sea level phenomena in recent years, such as the extraordinary El Niño of 1997-1998, which played havoc with normal climate patterns. Other features include 2005's Hurricane Katrina, 2004's Indian Ocean tsunami, and 1999's La Niña event. There’s also information on how space-based observations are helping forecasters predict the strength and intensity of hurricanes.


No comments:
Post a Comment